Forecast radar where you'll be, when you'll be there.
The only thing you know for certain about the radar forecast is that it is wrong.
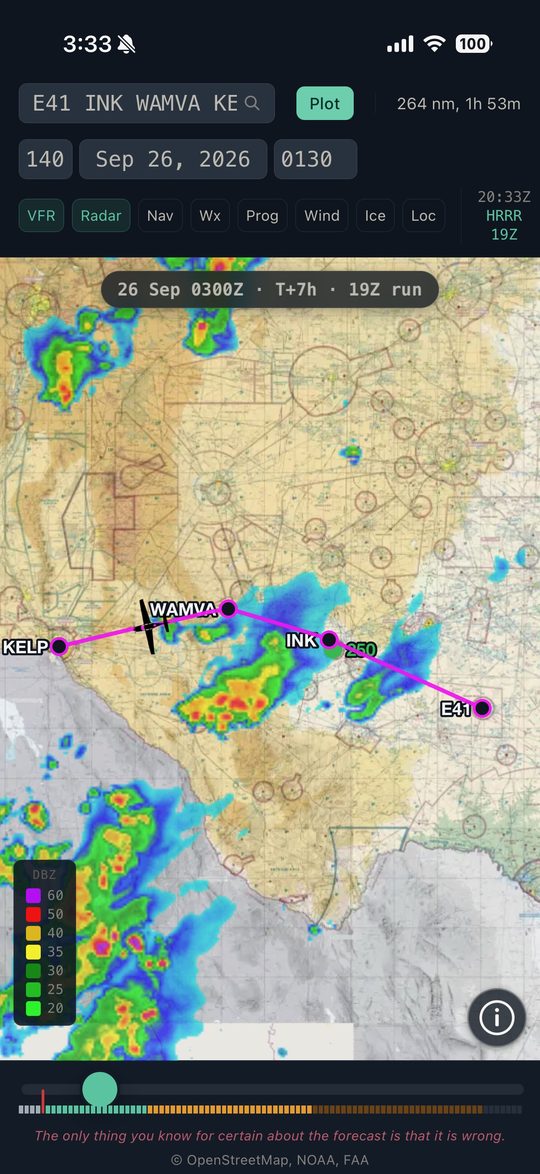
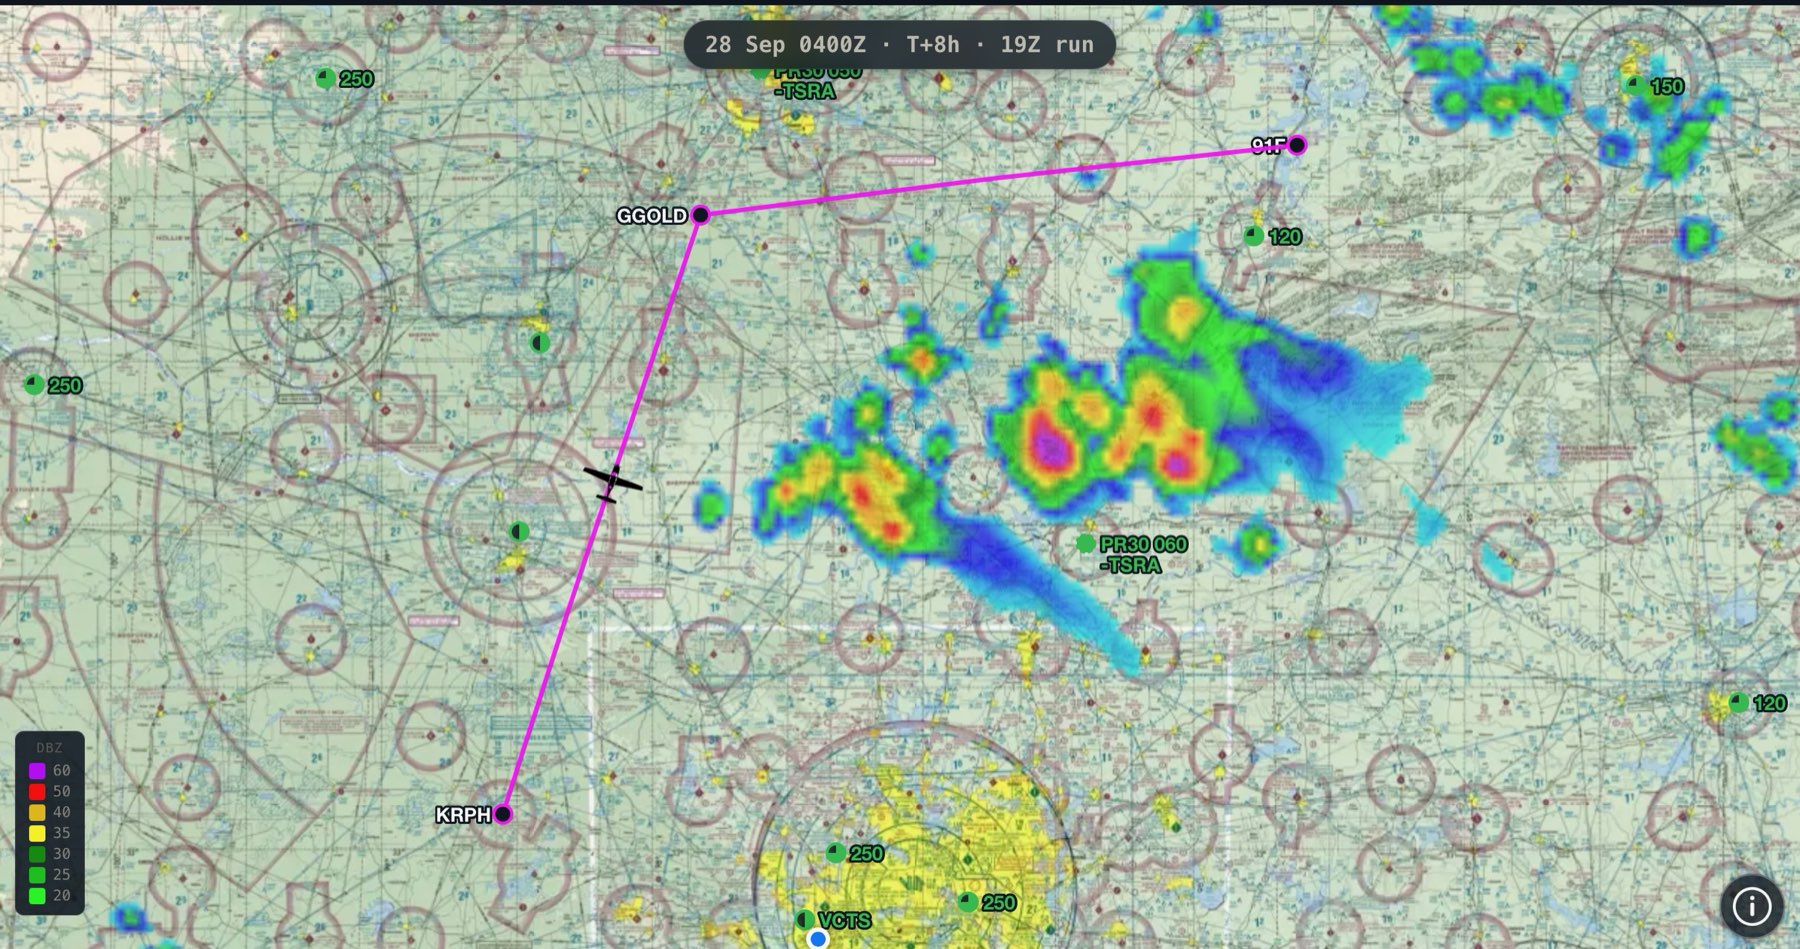
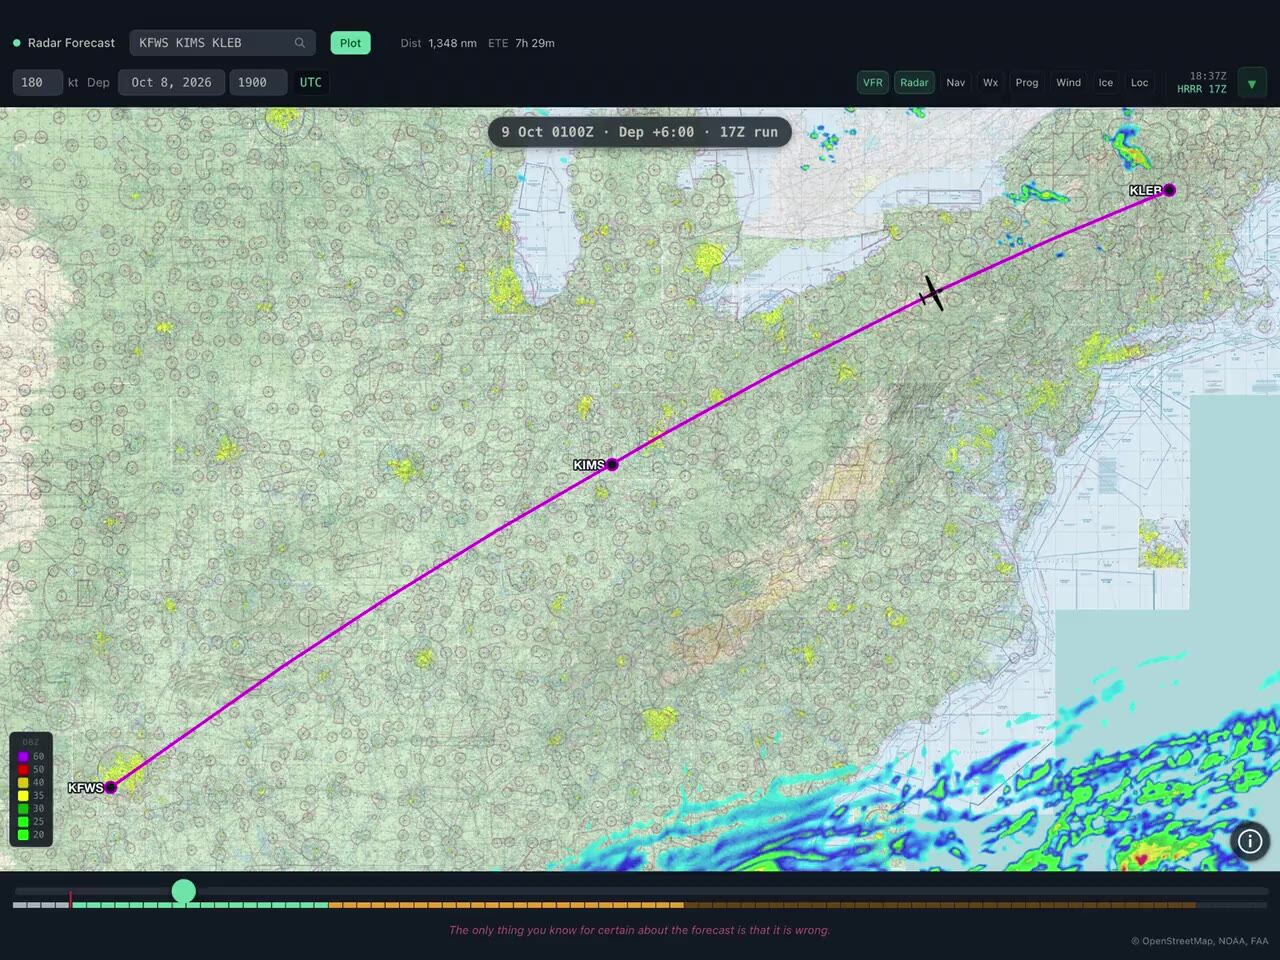
Radar Forecast answers one question: what will the weather be along my planned route at the hour I get there? Enter a route, a ground speed and a departure time. The app draws the route, computes distance and time en route, and puts an aircraft on the map in the right place at the right time. Drag the timeline and the aircraft moves while the radar changes underneath it, so the picture you are looking at is the forecast for your position at that hour.
The HRRR and RRFS Forecast Models
The HRRR and RRFS are two of NOAA's best forecast models. Each publishes an 18 hour forecast every hour and a 48 hour (HRRR) and 84 hour (RRFS) forecast every 6 hours. These forecasts are readily available on the internet in various places. However, they are arranged by forecast run, and they may take up to 50 to 90 minutes for the full forecast run to be published. Further, it can be difficult to determine where you plan to fly on their maps.
Radar Forecast solves this problem by taking the latest available forecast images and stitching them together into a convenient timeline so you see the latest available data before you fly. The ability to overlay and adjust a planned route enhances a pilot's ability to visualize what the weather will be doing and where the plane will be relative to the forecast.
High-Resolution Rapid Refresh · NOAA
A 3 km convection-allowing model over the continental United States. Every hourly run reaches 18 hours ahead; the 00, 06, 12 and 18 Z runs reach 48. The app always shows the newest frames available, so the far end of the timeline shortens as a run ages and springs back when the next 48-hour run posts.
Rapid Refresh Forecast System · NOAA
NOAA's next convection-allowing model: hourly updates on a 3 km grid covering North America, built on the FV3 dynamical core. Where HRRR's synoptic runs stop at 48 hours, RRFS reaches 84 from the same 00, 06, 12 and 18 Z cycles. Planned to become operational 14 October 2026.
How it works
Type identifiers separated by spaces — KFWS KLIT KMEM — then a ground
speed in knots and a departure time in Zulu. Plot draws the route and shows
distance and time en route.
Each step of the timeline is one forecast hour. Left of now, step back through observed radar to see which way a cell is actually tracking. Right of now, the aircraft slides along the route so the radar you see is the forecast for your position, not for a fixed spot on the map.
Planning
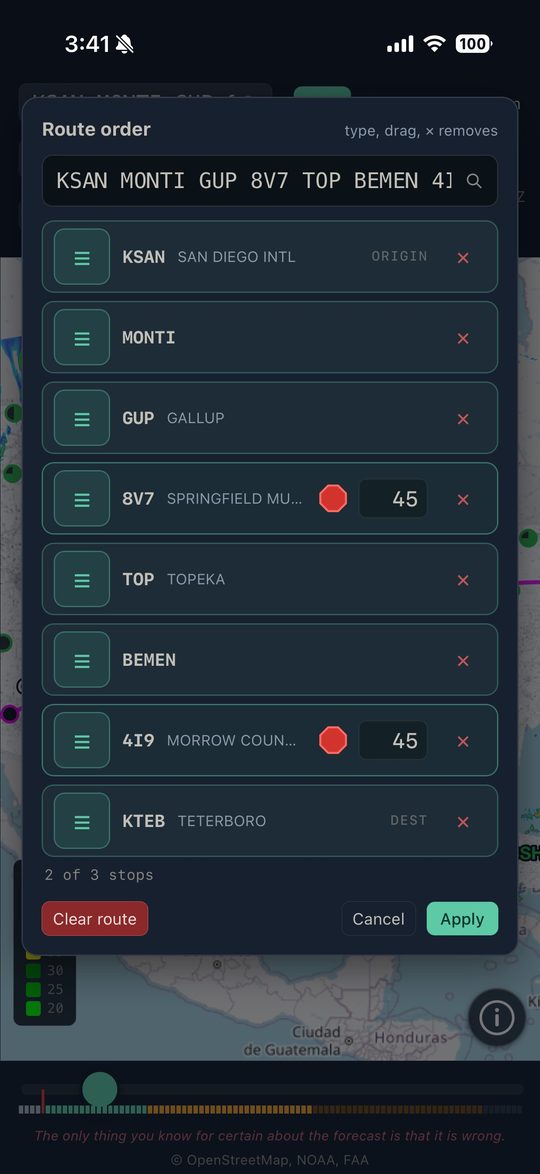
Long-press the map to find nearby fixes and tap one to add it to the route. Tap the route to open the planner, where you can reorder fixes by dragging, delete them, and turn up to three intermediate airports into stops.
Give a stop its ground time in minutes and the aircraft pauses there, so every later leg lines up with the right forecast hour. A fuel stop or a weather hold moves the whole downstream picture, which is the point.
If you know the field but not the identifier, use the magnifier in the route dialog. Type two or more letters and it searches airports by name — larger fields first, then alphabetically. Pick one and the map flies to it, the airport pulses so you can see which it chose, and the identifier is appended to your route, ready to plot.
Winds aloft
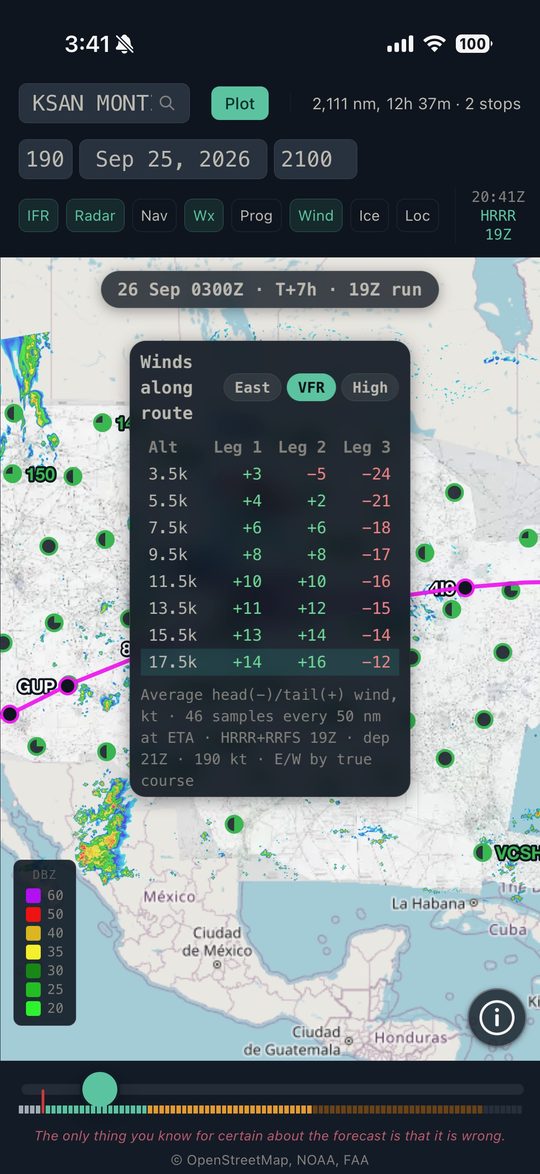
Use the wind table to better estimate your ground speed. It gives the average head or tail wind component for each leg at altitudes from 3,000 to 17,500 feet. Samples are taken every 50 nautical miles, each one at the time the aircraft actually crosses that point, then averaged across the leg.
Icing
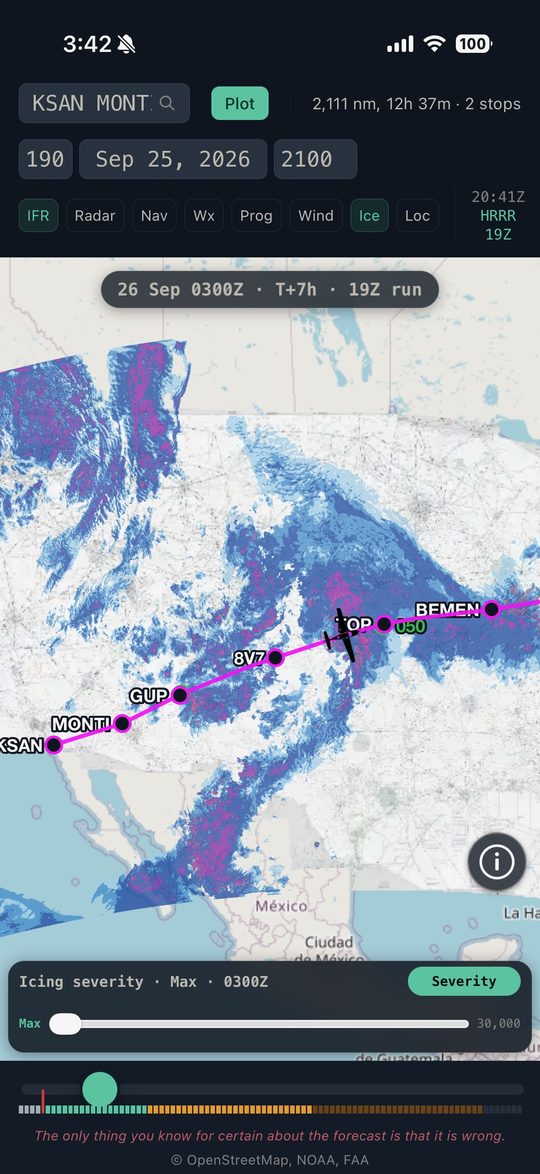
NOAA's in-flight icing analysis, filtered to the altitude band you care about. Drag the altitude control and the layer redraws; tap the map for the probability and severity profile at that point, level by level.
Tap the button to select among Severity, greater than 25% probability, greater than 50% probability, and Probability.
Prog charts
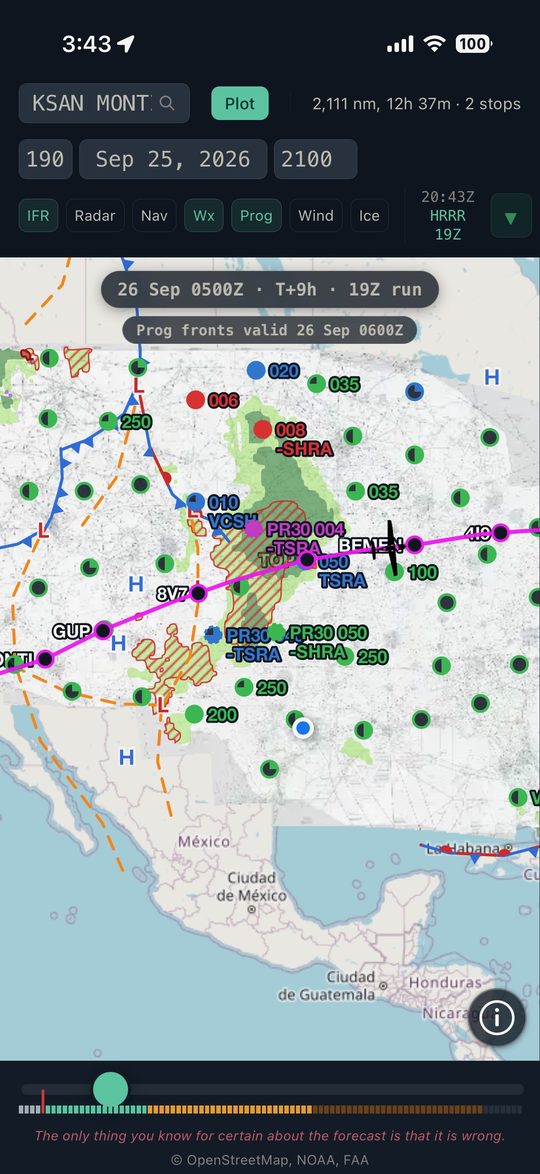
Radar shows you the weather; the prog chart shows you what is driving it. The Prog layer draws the Weather Prediction Center's surface analysis — cold, warm, stationary and occluded fronts, with highs and lows — over NDFD's forecast weather type, so you can see rain, snow, thunderstorms and freezing precipitation as shaded areas.
It moves with the slider like everything else. Step forward and the fronts march across the map with the cells, which is what tells you whether a line of storms is going to clear your destination before you get there or sit on it. Fronts are published out to about 48 hours; past that the shading continues alone.
Underneath it all, the base map cycles between a street map and the FAA's VFR and IFR enroute charts, so you can plan against the chart you would actually fly.
METARs and TAFs
The models are not the only forecast on the map. Stations on and near your route are drawn as coloured dots in the familiar flight categories — green for VFR, blue for MVFR, red for IFR, magenta for LIFR — and they come from the forecasters and the stations themselves, not from a model. Where a TAF disagrees with the forecast radar, that disagreement is worth your attention.
The dots follow the slider. At the "now" end of the timeline a station shows its METAR, which stays valid for an hour after it was issued. Move the slider forward and each station switches to the TAF period covering that time, so the colours you see are the categories forecast for the hour you would actually arrive. Where a METAR and a TAF are both valid, the METAR wins — an observation beats a forecast. Push far enough ahead that a station's TAF has run out and its dot simply disappears rather than showing you something stale.
Tap any station for its decoded METAR and TAF in full.
Nav layer
The navigation layer draws the fixes, airways and airspace underneath the weather, thinning out as you zoom away so it never buries the radar.
It exists to answer the question the radar raises. Once you can see the cell you need to miss, long-press the map to list the fixes near that point and tap one to add it to the route — then watch the timeline again to check the new line actually clears the weather.
Radar Legend
Colour is reflectivity in dBZ, and the same scale is used for forecast and observed frames, so shading is comparable along the whole timeline. Radar Forecast uses the same color scheme as the Garmin Pilot app, which places the dark green at the 30 dBZ level.
Dark green is 30 dBZ — the point at or above which to use extreme caution. If a cell contains anything above dark green, treat the entire cell as that highest intensity.
Radar imagery carries a level of detail that is misleading. Storms are not in the exact location shown, nor at the exact intensity shown; weather moves and changes constantly. What a forecast does give you is a reasonable estimate of where the weather will be, so you can plan around it.
Radar Forecast is a planning aid. It is not a certified EFB, not authoritative, and not for primary navigation. Always get an official preflight briefing — use ForeFlight, 1800wxbrief.com or aviationweather.gov for go/no-go decisions.